

 Browse IMO database.
 Biguglia (FRCO01)
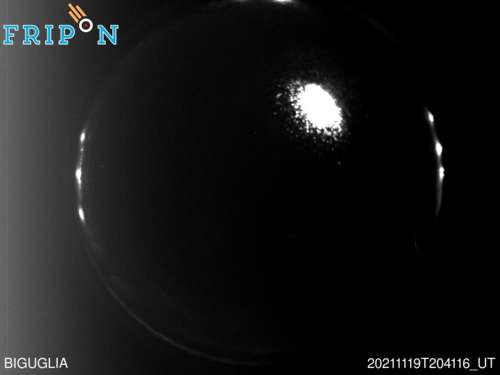
 Navacchio (ITTO02)
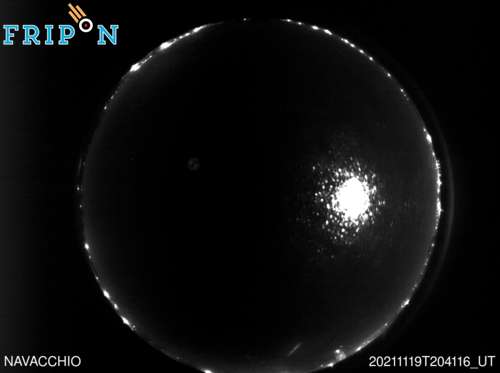 Trieste (ITFV01)
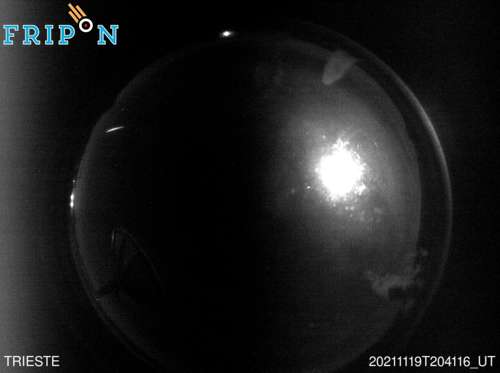 Agordo (ITVE04)
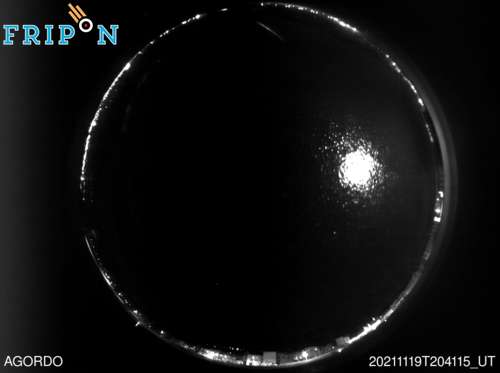 Arcetri (ITTO03)
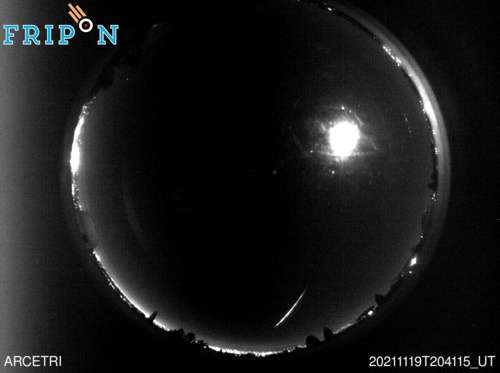 Ponte in Valtellina (ITLO05)
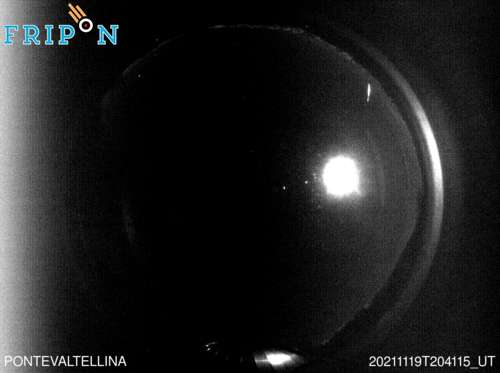 Vicenza (ITVE05)
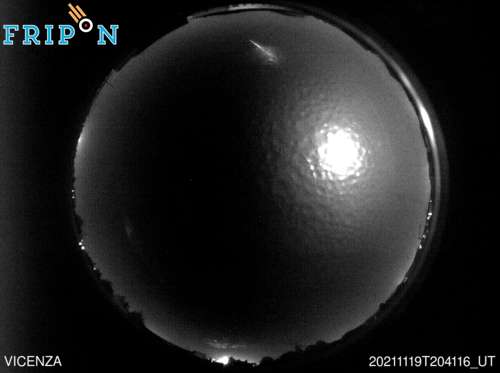 Montelupo Fiorentino (ITTO04)
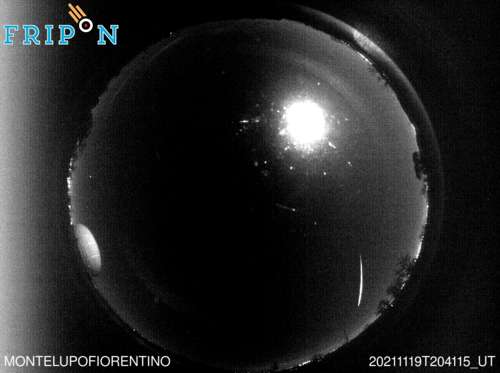 Chianti (ITTO05)
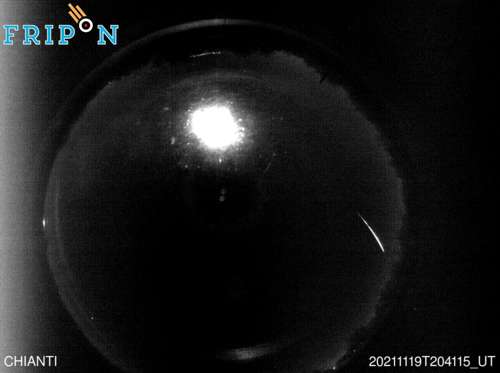 Piombino (ITTO06)
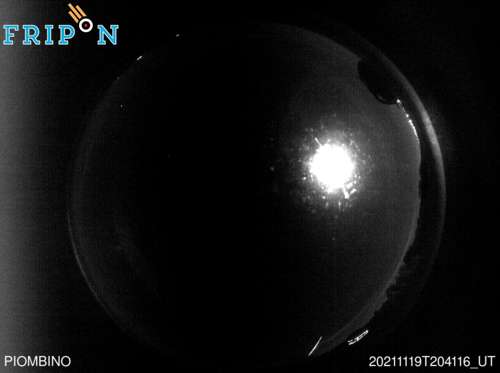 Rovereto (ITTA02)
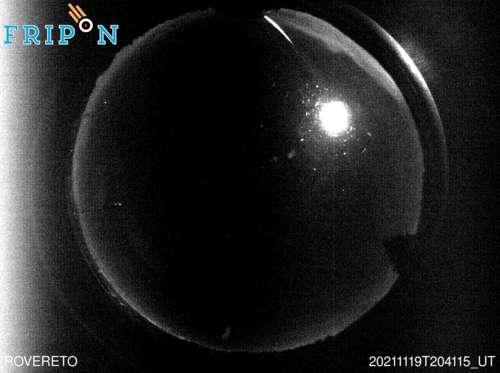 Perugia (ITUM01)
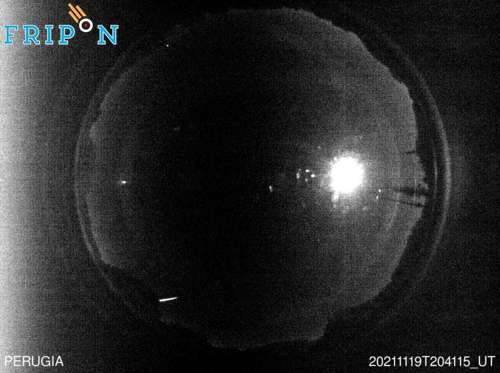 Amelia (ITUM02)
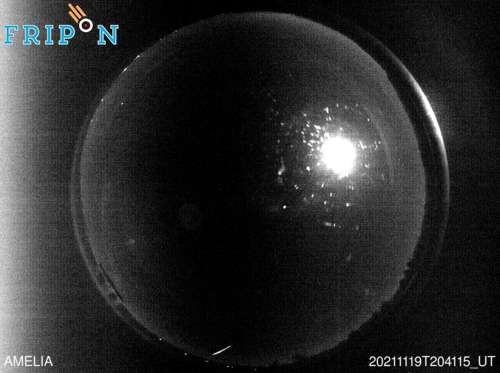 Novezzina (ITVE06)
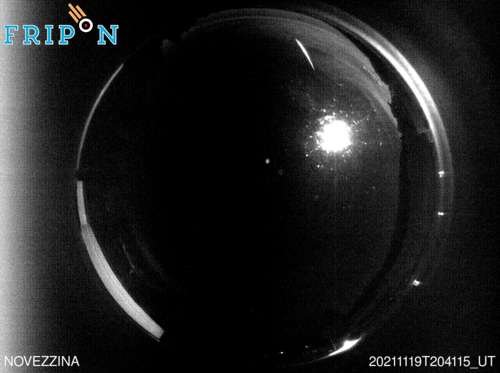 Elba (ITTO08)
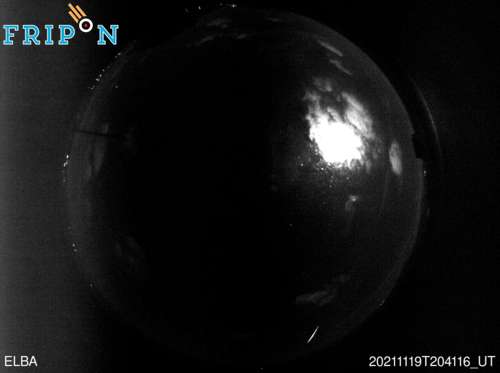
Because the FRIPON camera frame rate in 30/s and the filed of view is AllSky, the star limiting magnitude if barely 0 mag.
This prevents us from correctly perform the astro-photometry calibration. To overcome this difficulty, a long exposure image (5 sec) is taken once every 10 min.
This allows to detect star of up to magnitude 4, without disturbing the usual meteor detection process.
In order to bypass the weather limitation, a global astrometry calibration is performed once a month.
All detected stars are plotted together (green) in each of the figure shown below.
The rotation of the Earth creates star trails, except around the Polar star, which is therefore easily spotted.
The fireball is plotted in blue. The details of the method may be found in Jeanne et al 2019:
Calibration of fish-eye lens and error estimation on fireball trajectories: application to the FRIPON network, A&A
Biguglia (FRCO01) Navacchio (ITTO02)
 Trieste (ITFV01)
 Agordo (ITVE04)
 Arcetri (ITTO03)
 Ponte in Valtellina (ITLO05)
 Vicenza (ITVE05)
 Montelupo Fiorentino (ITTO04)
 Chianti (ITTO05)
 Piombino (ITTO06)
 Rovereto (ITTA02)
 Perugia (ITUM01)
 Amelia (ITUM02)
 Novezzina (ITVE06)
 Elba (ITTO08)
First graph: line of sights, from FRIPON cameras to the fireball. The plots are provided in a plane normal to the best fitted trajectory. Its origin lies at the crossing of all lines of sight.
Second graph: zoom of the previous figure, extending to 1-sigma (blue) and 2-sigma (green) confidence interval.
This allows us to double check the presence of systematic biases in the calibration process.
The details of the method may be found in Jeanne et al 2019:
Calibration of fish-eye lens and error estimation on fireball trajectories: application to the FRIPON network, A&A


First graph: Fireball velocity as function of altitude. Black dots are computed using a 5 position sliding average. The red line represents the ablation and drag model.
As fragmentation is not considered, light curve spikes and sudden deceleration events are not considered.
Second graph: the residuals of the fit.
The details of the method may be found in Jeanne et al 2019
Calibration of fish-eye lens and error estimation on fireball trajectories: application to the FRIPON network, A&A


Likelihood of the model of ablation and drag of the fireball. Each point represents a set of parameters (V0, A, B). These points are drawn evenly in this space parameters, then represented in the plane (V0, A). A corellation of parameters V0 and A leads to a decentering of the group of points. Conversely, a centered cloud indicates that the model is correctly adjusted, and that the A and Vo parameters are reliable. The unbiased determination of the parameter A (drag) is essential for the determination of the initial mass, as the initial speed V0 for determining the orbit. For precise information, refer to the article by F. Colas et al 2020 : FRIPON: a worldwide network to track incoming meteoroids, A&A

Likelihood of the model of ablation and drag of the fireball. Each point represents a set of parameters (V0, A, B). These points are drawn evenly in this space parameters, then represented in the plane (A,B). A corellation of parameters A and B leads to a decentering of the group of points. Conversely, a centered cloud indicates that the model is correctly adjusted, and that the A and B parameters are reliable. The unbiased determination of the parameter B (ablation) is essential for the determination of the final mass mass. For precise information, refer to the article by F. Colas et al 2020 : FRIPON: a worldwide network to track incoming meteoroids, A&A
Fireball absolute magnitude as a function of altitude, as deduced from the measurements performed by each camera.
The absolute magnitude is the magnitude the fireball would present at an altitude of 100km at the zenith.
If the weather is perfectly clear at all stations, all absolute magnitude curves overlap.
In reality, atmospheric extinction due to the presence of clouds might induce biases. In addition, the photometry calibration is performed once a month (similarly to astrometry calibration).
The details of the method may be found in Jeanne et al 2019:Calibration of fish-eye lens and error estimation on fireball trajectories: application to the FRIPON network, A&A


The 3D (left) and 3D (right) orbit of the meteoroid responsible for the detected fireball is shown in heliocentric ecliptic J2000 frame.
Units are astronomical units (AU). The 4 first cercles represent the orbits of Mercury, Venus, Earth and Mars.